Morning review:
Dear friends, I am Don Adam Perera, and I am very pleased to be with you all in our community today to discuss the impact of the Producer Price Index (PPI) data on the trajectory of the stock market. Through today’s sharing, we will delve into how PPI data affects stock market dynamics and how we can use this information to optimize our investment portfolios, thereby achieving steady wealth growth. I hope everyone actively participates in the discussion to jointly analyze and explore the trajectory of the stock market.
1.What is the Producer Price Index (PPI) data, and how does the released data impact the stock market?
2.How are the stocks in our investment portfolio currently performing, and what actions should we take today?
I will be sharing on these topics.
Economic data acts as a barometer for the stock market. By conducting in-depth studies of these key economic indicators, we can more accurately predict and understand the trends of the stock market.
Today, our focus is on the newly released Producer Price Index (PPI) data. The PPI is an important economic indicator that measures changes in the prices of goods and services from the perspective of the producer during the production process. It primarily reflects changes in the production costs of businesses. These cost changes often pass through to consumer prices, thereby impacting inflation.
By deeply analyzing the PPI data, we can better assess the potential scale and pace of rate adjustments by the Federal Reserve, which directly guides our investment decisions.
The Producer Price Index (PPI) data released today is as follows: The PPI for August actually rose by 0.2% month-over-month, which was higher than the market expectation of 0.1%, with the previous value revised from 0.1% to 0%. Year-over-year, the August PPI was 1.7%, slightly below the expected 1.8%, with the previous value also revised from 2.2% to 2.1%. This data indicates that the pressure of rising production costs has eased somewhat, but there is still some growth.
Following the release of such PPI data, the swap market remained stable, indicating that the market had already anticipated this outcome to some extent. For the stock market, moderate growth in the Producer Price Index may alleviate concerns over excessive inflationary pressures in the future, helping to stabilize market sentiment.

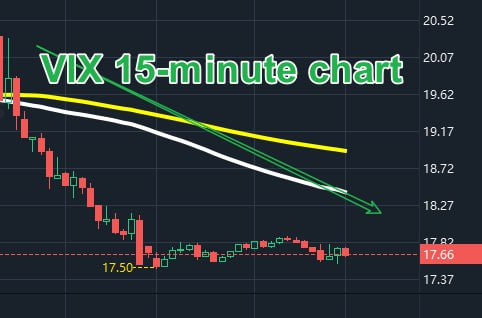
The VIX trend is negatively correlated with the stock indices. The overall price trend on the 15-minute VIX chart is in a fluctuating pattern, indicating that market investors’ sentiments are relatively stable, which will have a positive effect on the stock market performance. Manage your positions well and patiently wait for the real-time performance of individual stocks.

Let’s now focus on the performance of the three major stock indices:
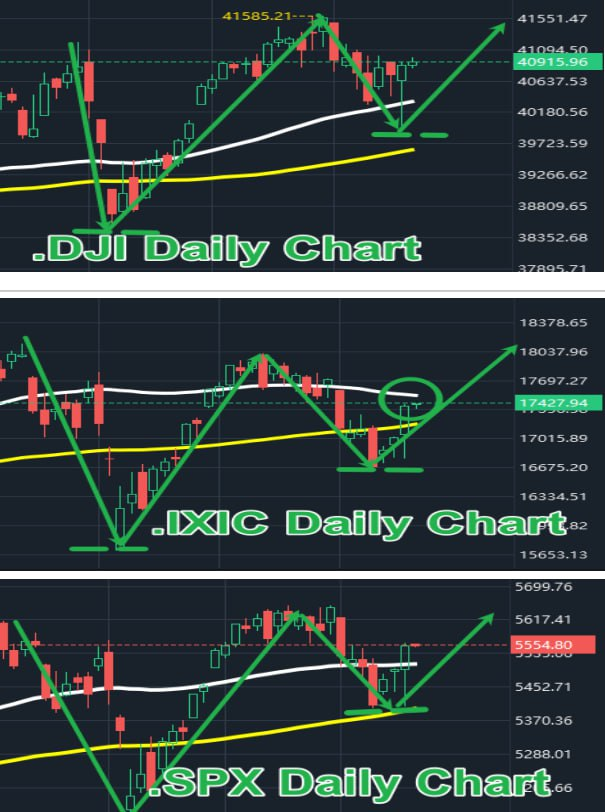
Yesterday, the Dow Jones Industrial Average experienced a significant pullback before beginning to bottom out and rebound, ultimately closing with a long lower shadow and breaking through the white trend line. This action signifies a strong bullish rebound. Currently, the Dow not only continues the bullish trend but has also firmly held above the white trend line, showing a significant increase in bullish momentum.
After a short-term pullback, the Nasdaq Composite found very strong support and began to rebound. It has successfully broken through the yellow trend line and is now challenging the white trend line. A breakthrough of this line would further confirm the strength of the bullish counterattack.
The S&P 500 index, after pulling back to the yellow trend line, quickly rebounded and successfully broke through the white trend line, and is now steadily advancing towards its previous highs. This is a very typical rebound trend performance.
Overall, the trends of the three major stock indices indicate a healthy and robust market environment. Given the upcoming rate cut policy by the Federal Reserve, investors are presented with a rare investment opportunity, making now an excellent time to seize wealth opportunities. Let’s continue to monitor market developments and be fully prepared to act at the right time to maximize our investment returns.

Now, let’s focus on the stock chart performances within our investment portfolio and explore the price trend trajectories of NVDA and TSLA.
Yesterday, at a tech conference hosted by Goldman Sachs, Jensen Huang, the CEO of NVDA, delivered a positive message to the audience: there is extremely strong demand for NVDA’s products, particularly for its latest generation chip, “Blackwell.” Suppliers are scrambling to catch up with this surge in demand. Following this announcement, there was a significant positive impact on NVDA’s stock price, leading to a strong rebound trend.
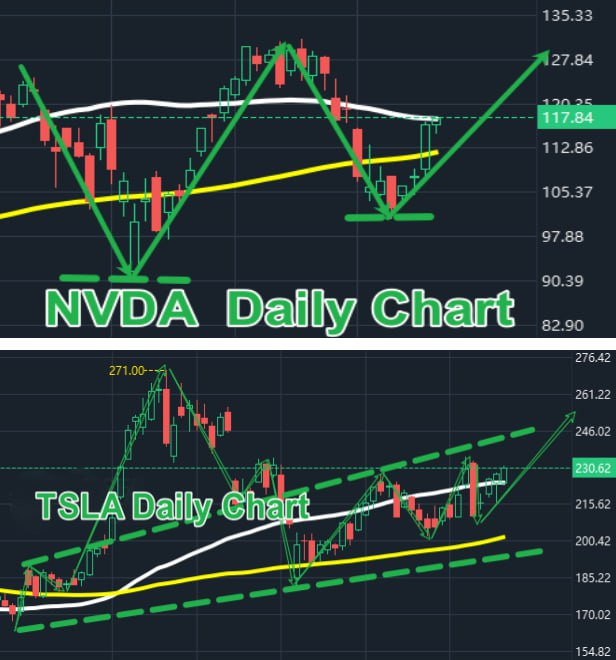
Currently, after experiencing a short-term pullback, NVDA has once again entered a rebound trend and has successfully broken through the yellow trend line, now mounting a strong challenge to the white trend line. Additionally, the stock price is gradually forming a “W” shape, further indicating the unfolding of a new rebound trend. We are now standing at the starting point of this new rebound trend.
As NVDA continues to make progress in technology and market demand, we should closely monitor its stock price movements and be prepared to continue holding once we confirm the trend remains positive, aiming for steady growth in profit returns.
TSLA’s overall trend direction remains in an upward channel. After experiencing a short-term price retracement and forming a strong support level, TSLA has begun to rebound and has successfully broken through the white trend line. This action clearly indicates that the bullish forces in the market have launched a powerful counterattack, pushing the stock price to higher levels.
Given TSLA’s healthy trend performance, our current strategy is to continue holding and wait.
Dear friends, with the Federal Reserve’s impending rate cut, the overall trend of the three major stock indices is healthy, and the stocks in our portfolio are performing well. This is a crucial moment for us to seize financial opportunities. So, how should we proceed?
1.We need to continuously optimize the stocks in our portfolio. Specifically, we can operate combining short-term and medium-term strategies. For stocks that are profitable, we can adopt a strategy of reducing our holdings. When the stock price retraces to near strong support levels, we can then replenish the reduced positions, thus balancing risk and reward.
2.As long as the stocks in our portfolio maintain a healthy trend and stable fundamentals, we can continue to hold and wait, even if there are short-term price fluctuations. However, if certain stocks face issues with their fundamentals or there are negative news affecting their ongoing profitability, we should sell promptly, freeing up positions to await new financial opportunities.
3.To fully seize the current stock market opportunities, we should prepare sufficient funds to participate in stock trading, achieving steady growth in wealth and progressing towards the goal of financial freedom.
4.Adjusting the positions in our investment portfolio is also crucial; it is advisable not to operate at full capacity. Specifically, we can allocate our positions as follows: 15% for short-term strategies, 20% for medium-term strategies, and 30% for long-term strategies.

It’s fantastic that AVGO has once again proved its strong market outperformance. Those of you who took positions with us yesterday are now enjoying an 8% return on their profits. We at New World Asset Management have been rewarding our community with quality stocks through our New World Quantitative 4.0 Investment Decision System, and we hope you all can feel the thrill of this quick profit.
For those of you who have AVGO in your hands, you should take profit and reduce your position by half, and then we will continue to closely monitor the subsequent market development of AVGO and share the latest information with the community in a timely manner. We will continue to monitor AVGO and share the latest information with the community. In addition, we will continue to screen another high quality stock that is expected to make a profit of 30% or more through the New World Quantitative 4.0 Investment Decision System tomorrow. For those who are interested in participating in tomorrow’s simultaneous position building, please contact our assistants directly to sign up.
Dear friends, if you feel uncertain about the future direction of the stocks in your position, I suggest you can send the stock information to my assistant. She will provide you with objective and professional market analysis and trading strategies using our proprietary investment tool – New World Quantitative 4.0.
Our goal is to ensure that every member achieves solid profit growth and outperforms others on their investment path. If you have any questions or need help, please don’t hesitate to contact one of our assistants today!
From version 1.0 to version 4.0, each upgrade of the New World Quantitative 4.0 investment decision-making system has been the result of countless days and nights of work by our team of top investment experts, analysts, and R&D team.
New World Quantitative 4.0 is not just a tool, it is a continuous learning and evolving system that absorbs new market data and optimizes its algorithms every day to ensure that our investment decisions remain at the forefront of the industry.
Since its initial 1.0 version, our New World Quantitative 4.0 investment decision system has implemented basic algorithmic trading functions, laying a solid foundation for the entire system’s development.
With technological advancements, we introduced more data analysis tools and more complex algorithms in version 2.0, significantly improving the accuracy and execution speed of trading decisions.
In version 3.0, by integrating advanced machine learning technologies, our system not only enhanced its ability to predict market dynamics but also improved its adaptability to various market changes. The integration of these technologies made our 3.0 version system more efficient and flexible in handling complex market situations.
Now we’ve reached the latest version, 4.0, of our system, which not only perfects the features of the previous three versions but also integrates my understanding of the investment market and all my investment philosophies. Additionally, we’ve seamlessly incorporated powerful technical indicators such as Bollinger Bands, moving averages (MA), MACD, KDJ, and RSI into the system, truly embedding my soul into the New World Quantitative 4.0 investment decision system. Currently, its success rate has reached an impressive 89%.
New World Quantitative 4.0 now has very powerful capabilities, perfectly integrating advanced algorithmic trading with advanced quantitative trading to provide comprehensive and precise investment support for a wide range of investors. It consists of four core components: a trading signal decision system, a quantitative trading system, an investment strategy decision system, and a system of experts and investment advisors. These systems work together, covering multiple investment areas such as stocks, options, bonds, gold, and cryptocurrencies, and can support investment decisions in various market conditions.
Every day, the New World Quantitative 4.0 investment decision system extracts market information that is substantively helpful to our investment decisions through deep analysis and filtering of big data. Based on this information, the system helps us develop diversified asset allocation plans aimed at enhancing the stability of our investment portfolio and maximizing the potential for wealth growth.
With this comprehensive investment decision support, New World Quantitative 4.0 is not just an investment tool, but also a solid backing for each friend to achieve financial health and wealth growth.
Dear community friends, the stock market’s counterattack has begun, and it’s a time of opportunity, but only those who are fully prepared will benefit. Now is the best time to review and optimize your investment portfolio, to prepare for the upcoming market changes and ensure steady wealth growth.
Later, I will continue to discuss with you all the application of the MACD indicator in stock trend analysis, helping you to more accurately assess market dynamics. See you later.
That concludes this morning’s sharing session. Please actively participate in the community’s Q&A to earn more raffle points through active interaction. This will not only enhance your understanding and application of investment knowledge but also help you accumulate enough points for this Friday’s raffle, increasing your chances of winning prizes.
1.What is PPI data, and what is its function? (15 points)
2.What are the key components of the Eagle Eye Quantitative 4.0 investment decision system? (30 points)
Closing commentary:
Dear friends, I’m Don Adam Perera, and I’m delighted to spend this wonderful afternoon with you all. Here, we have not only discussed the trends of the stock market but also continuously optimized our investment portfolios, together stepping towards the path of steady wealth growth.
1.How is the current stock market performing?
2.What is our main strategy for the current market conditions?
3.What are the applications of MACD in stock market trend analysis?
I will be sharing content on the topics above.

The focus is now on the trends of the three major stock indices: the Dow Jones Industrial Average, the Nasdaq Composite, and the S&P 500 index are all showing signs of stabilizing and rebounding, conveying confidence in the continued rise of the stock market. Moreover, given that the Federal Reserve’s rate cut policy is about to be implemented, the overall investment market environment remains healthy and positive. Therefore, we maintain an optimistic attitude towards the stock trends in our investment portfolio.
At this stage, my view remains steadfast: we should adapt to the severe fluctuations in stock market prices and correctly handle the phenomenon of short-term retracements in stock prices. Do not let short-term price corrections shake our confidence and expectations in our holdings. Maintaining a long-term investment perspective and approaching market fluctuations with a calm mindset is key to achieving investment success.

Let’s now focus on the performance of stocks in our portfolio: The gold-related stock, NEM, has sounded the horn for a rebound once again. After its price underwent a short-term retracement, it has stabilized and rebounded from the lower edge of its upward channel, forming a very attractive rebound trend. Currently, its overall trend remains robust, continuing to rise, and it is challenging the recent high of $53.88.
With the Federal Reserve’s impending rate cut, which is expected to positively stimulate gold, stocks in the gold sector are also likely to benefit. Therefore, we choose to continue holding and waiting with NEM.

AVGO’s performance has undoubtedly impressed us all, bringing about a 9% profit return for our community friends. As the stock price continued to rise, we strategically locked in profits on half of our positions. This is exactly the practice of combining short-term and medium-term strategies that we often discuss with our community friends.
Specifically, during AVGO’s rebound, we chose to lock in some profits at the high points. This way, if AVGO experiences a short-term retracement to a strong support level, we will have the opportunity to replenish the positions we previously reduced, thereby optimizing our investment returns.
Proper allocation of investment portfolios is the key to diversifying our investment risks and increasing our return potential. It can also effectively help us withstand market volatility and achieve solid wealth growth. Therefore, I encourage everyone in the community to actively participate in portfolio allocation and continuously optimize their stock positions.
Dear Friends of the Community, Tomorrow, we will continue to use the New World Quantitative 4.0 Investment Decision System to screen for quality stocks in the market. Together with all my friends in the community, I will be building a position in this selected quality stock with an expected profit potential of 30%. This is a very good opportunity. If you are interested in joining us for tomorrow’s simultaneous position building event, then please contact my assistant directly to pre-register and secure your spot.
On tomorrow, please send a screenshot of your trade to my assistant after you have completed your position building operation. This way we can ensure effective tracking of each friend’s investment. Remember, as long as I share the wealth opportunities in the community and you participate according to the trading strategies we have developed, I will be responsible to the end, continuously tracking the latest developments in the stock and sharing them with the community in a timely manner in order to develop a more comprehensive trading strategy for you.
Today’s stock market wealth opportunity sharing has concluded, and now we will move on to the next part of our wealth learning journey. In the upcoming session, I will focus on discussing the important components of the MACD indicator with everyone. MACD, as a tool widely used in technical analysis, provides precise signals that can greatly help us grasp market trends and trading opportunities.
1.What is MACD?
MACD, or Moving Average Convergence Divergence, is developed based on the principles of moving average construction. It smooths the closing prices of stocks to calculate their arithmetic averages, thus constructing a trend-based technical indicator. MACD is primarily used to determine market trend direction, the strength of momentum, and potential price reversal points.
By using MACD, investors can more accurately identify market trends and seize the best times to buy or sell, thus finding profitable opportunities in a volatile market.
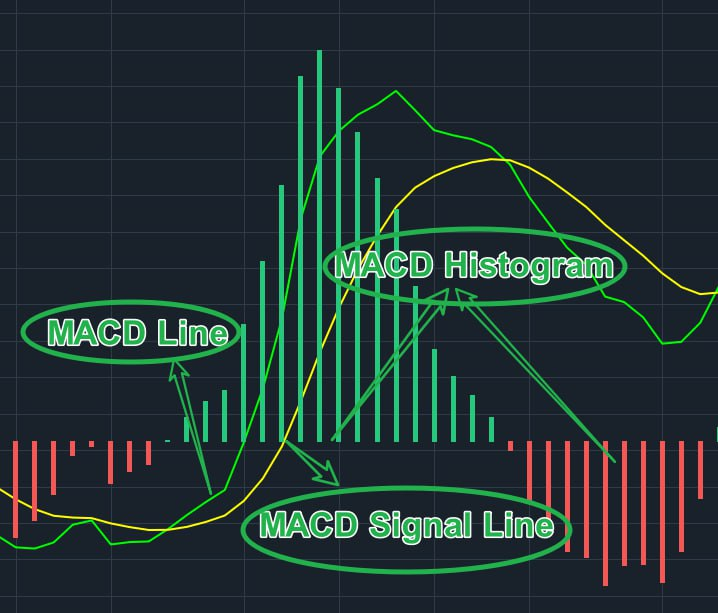
2.Components of MACD: MACD line, MACD signal line, and MACD histogram, as shown in the figure.

Dear friends, today I focused on sharing the basic concepts and components of MACD with you all. I hope that through today’s sharing, you have gained a deeper understanding of MACD.
Tomorrow, we will continue our journey of investment and wealth learning. During this process, I will focus on synchronously establishing positions with the community in high-quality stocks that are anticipated to yield a 30% profit. Additionally, I will further share how to use MACD in trading, helping everyone apply it more effectively in daily trading to identify market trend changes and make more accurate trading decisions.
Please be prepared and actively participate in tomorrow’s learning and trading activities. By combining practice and theory, we can better grasp market dynamics and achieve steady growth in wealth. Thank you all for participating today, and I look forward to meeting with you again tomorrow. See you tomorrow.

Dear friends, tomorrow is about to open the most exciting raffle with great prizes, which are as follows:
First prize: 100 NWC tokens
Second Prize: 10,000 USDT
Third Prize: 50 NWC tokens
Fourth Prize: 10-20 NWC tokens or 100-500USDT
Fifth Prize: 50USDT
Participation Prize: 20USDT
I sincerely hope that each of you can accumulate enough points to participate in tomorrow afternoon’s raffle and have the chance to win the prizes you desire.
For those who don’t have enough points, please actively participate in today’s knowledge quiz by correctly answering questions to earn the necessary raffle points. This is not only a chance to win prizes but also a great opportunity to reinforce and test your learning outcomes.
1.What strategy have we adopted to participate in trading given the current market environment? (15 points)
2.What are the components of MACD? (15 points)
