Morning review:
Dear friends, good morning. I am Don Adam Perera, and I am delighted to discuss the impact of PCE data on the stock market with our community friends today. Together, we will explore new wealth opportunities and march towards financial freedom.
1.What is PCE data, and how does it affect the stock market?
2.How can we judge the direction of the stock market and identify the main trend?
3.How are the stocks performing in our investment portfolio, and how should we proceed?
I will share on these topics.
In the investment market, the direction of policies and the interpretation of economic data are crucial, as they collectively guide the movement of the market. Particularly, economic data acts like a barometer for the stock market, providing us with key clues to assess the state of the market.
Now, let’s focus on PCE data and explore the trajectory of wealth it indicates: PCE data, or the Personal Consumption Expenditures Price Index, is a critical indicator of inflation, reflecting the price changes of goods and services that consumers buy. This data not only influences our judgment of inflation trends but also directly affects the monetary policy decisions of the Federal Reserve, especially playing a key role in determining the extent and pace of interest rate cuts.
Therefore, the PCE data released today will be of utmost importance. It will not only affect the immediate market response but will also provide a crucial reference for our future investment decisions.
The core PCE price index for July released today shows an annual rate of 2.6%, slightly below the market expectation of 2.70%, but consistent with the previous value of 2.60%. The monthly data is at 0.2%, aligning with the market forecast of 0.20% and identical to the previous value of 0.20%.
From these data, while inflationary pressures exist, they remain relatively stable overall, indicating that core inflation has not accelerated unexpectedly, which might result in a neutral immediate market reaction. As a critical indicator for the Federal Reserve in measuring inflation, the stable performance of the core PCE can ease market concerns about the Fed aggressively adjusting monetary policy, thus providing some support to the stock market. Overall, today’s data helps maintain investor confidence and market stability, offering solid data support for the upcoming Federal Reserve rate cuts.
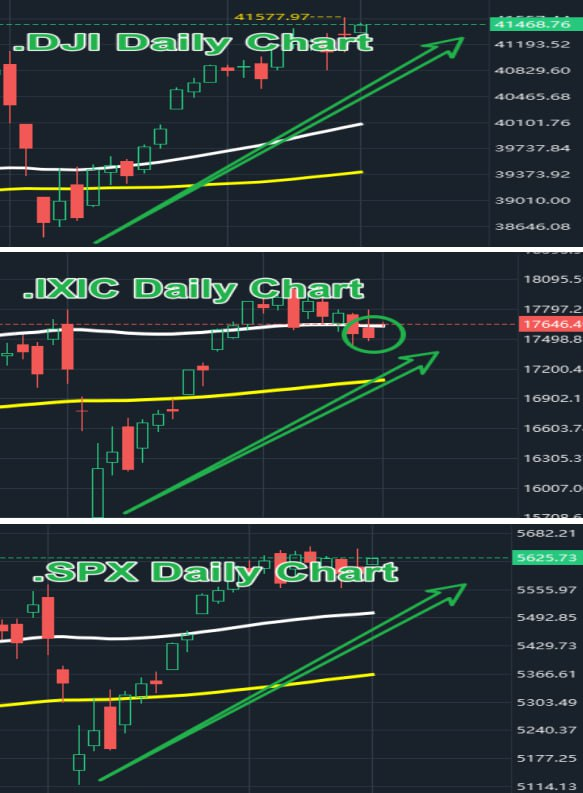
Currently, the performance of the three major indexes: The Dow Jones Industrial Average continues its rebound trend and is once again challenging its historical highs. The Nasdaq and the Dow Jones are both experiencing narrow fluctuations. With the trends of the three major indexes being solid, what we need to do next is to patiently monitor the performance of individual stocks.
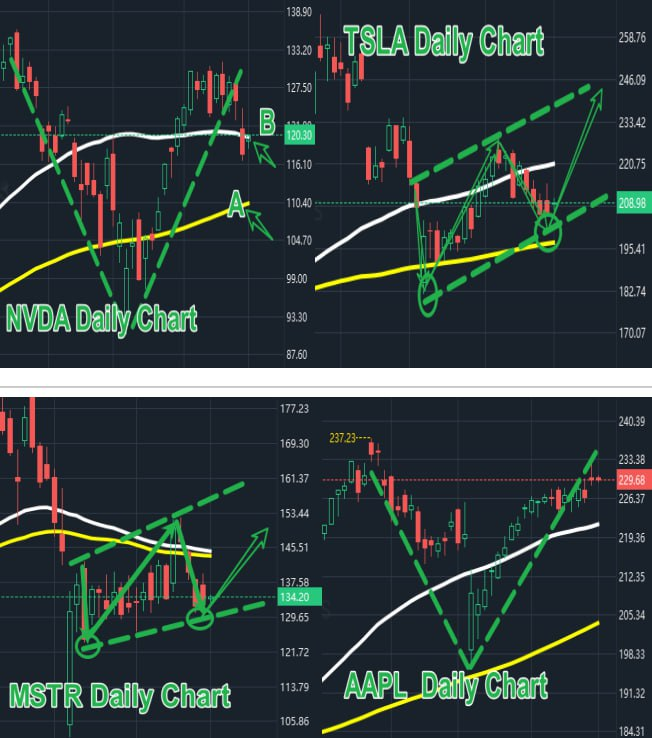
Let’s now turn our focus to the performance of stocks in our investment portfolio.
From the current chart analysis, we can draw the following conclusions:
1.Although NVDA’s recently announced earnings exceeded market expectations, they did not meet the highest profit forecasts, leading to a short-term price adjustment. Nonetheless, NVDA’s fundamentals remain strong, and the outlook for fourth-quarter revenue is very optimistic. Therefore, the upward price trend for NVDA has not changed. We should focus on points A and B: a price pullback to point A or a successful breakout at point B should be considered good opportunities to enter the market.
In summary, despite the market’s adjustment to NVDA’s short-term performance, the company’s strong fundamentals and positive revenue forecasts will support its stock price continuing to rise in the long term.
2.The stock prices of TSLA and MSTR have shown similar patterns, both pulling back to the lower edge of their respective upward trend lines. This position is often considered a key support area in technical analysis. Once this support is validated by market behavior, we can anticipate very good rebound opportunities for both stocks.
Therefore, such a pullback is not a sell signal but a potential buying opportunity, especially after confirming that the support is valid. In making investment decisions, the key is to observe the market’s reaction to this technical position and make rational investment choices based on this. If the support level continues to be confirmed, then this will be a good opportunity to add to positions or establish new ones.
Therefore, for those watching TSLA and MSTR, now is the time to closely observe market reactions and prepare to act. Let’s remain patient and wait for the market to provide more signals.
3.The current market performance of AAPL shows that its fundamentals are still strong, and it has demonstrated a very powerful “V” shaped pattern technically. This type of trend usually indicates an extremely strong directional move in the stock price, signifying the market’s positive evaluation and strong support for AAPL.
In this context, when AAPL’s price pulls back to a strong support line, it is often viewed as an excellent buying opportunity. This price dynamic indicates that, after a brief price adjustment, the stock is likely to rise again and continue its upward trend. AAPL’s current market performance not only reflects its solid fundamentals but also demonstrates its strong momentum on a technical level.
Based on the current performance of the stocks, we can choose to hold temporarily and wait for further market developments. Over the next week, I will optimize the portfolio based on the specific performance of the stock market. Therefore, I hope all friends will continue to follow our community updates and stay tuned for shared insights.
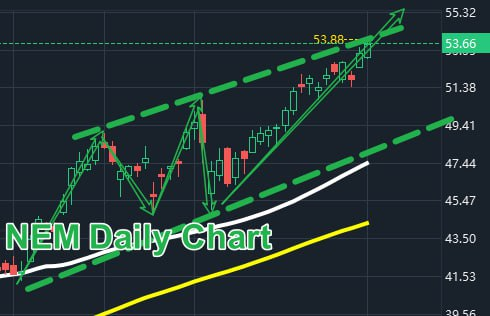
Currently, our mid-term strategy stock, NEM, is once again reaching new highs, showing a very impressive market performance. At this point, I want to again congratulate those community friends who have built positions in this stock alongside us; your profits continue to grow steadily. I firmly believe that NEM will continue to provide us with more profit returns. In this favorable market trend, we should continue to keep our focus.
Therefore, I strongly hope that all friends in our community will actively follow our community’s shares. Real-time market news, interpretation of economic data, sharing of wealth opportunities, and detailed explanations and sharing of investment knowledge and techniques will all be conducted within the community.
Additionally, next week I will continue to share in-depth with our community friends our core technological achievement at New World Asset Management—the New World Quantitative 4.0. This patented tool was developed through countless days and nights of effort, wisdom, and dedication by a team of 30 top investment experts and analysts, each with 30 years of professional investment experience, and our joint research and development team. It is designed to make investment trading simpler and more efficient for investors.
New World Quantitative 4.0 is incredibly powerful, integrating four major systems: “Trade Signal Decision System,” “Quantitative Trading System,” “Investment Strategy Decision System,” and “Expert and Investment Advisor System.” It comprehensively covers multiple markets including stocks, forex, bonds, options, gold, and cryptocurrencies. It is precisely because of the robust capabilities of New World Quantitative 4.0 that we are able to provide users with precise and diversified asset allocation recommendations.
I am very much looking forward to discussing in depth with all of you the workings and methods of using New World Quantitative 4.0, understanding its role in different market conditions, and how it can help us achieve asset appreciation.
In recent shares, I have shared with our community friends how to accurately identify buy and sell points during upward, downward, and sideways trends in stock movements. Additionally, we have discussed methods for determining buy and sell points for W patterns and flag consolidation patterns. Coming up, I will share about recognizing and analyzing converging triangle patterns, triple bottom/triple top patterns, rounded bottom/rounded top patterns, head and shoulders bottom/head and shoulders top patterns, and cup with handle patterns. These typical market patterns have been successfully integrated into the New World Quantitative 4.0 investment decision system, allowing us to more precisely determine the best buying and selling points for stock market trends, thereby providing us with more robust profit returns.
Therefore, I hope that every member of our community pays close attention to and learns from the content we share, taking detailed notes to ensure a deep understanding and application of this knowledge in real trading scenarios. This is precisely the core educational philosophy of New World Asset Management: “Client interests first” and “Theory plus practice is the best way to enhance practical abilities.”
Therefore, I strongly hope that every member of our community takes each day’s learning opportunities seriously, quickly grasps the workings and methods of using New World Quantitative 4.0, and becomes proficient in applying it to their own investment practices. Once New World Quantitative 4.0 successfully launches, I believe it will become a strong backbone in our investment careers, helping us to progress steadily in the investment market and effectively grow our wealth.
Dear friends, I will delve deeper with you later into the stock trend pattern—the converging triangle pattern. I will thoroughly analyze how to determine the best buying and selling points within this pattern. Please continue to follow our community’s updates, don’t miss the upcoming shares. See you later.
Closing commentary:
Dear friends, hello, I am Ridel Bosco Castillo. I am very pleased to be here with every one of you in our community. On this beautiful afternoon, let’s review the performance of our investment portfolio this week and the application of practical skills, while also fully preparing for the opportunities and challenges of the upcoming week.
1.What are the main themes in the current market and the portfolio?
2.Stock market trend patterns—converging triangles, how do we confirm buying and selling points?
I will share content on these topics.
Let’s first understand the current investment market environment:
1.Federal Reserve Chairman Powell has signaled the strongest indication yet of a rate cut:
Rate cuts will reduce the borrowing costs for businesses, allowing them to access necessary funds at lower costs. This not only helps to enhance the profitability of companies but may also encourage business expansion and increased investment, thereby boosting overall economic vitality.
From an investor’s perspective, rate cuts are often seen as an economic stimulus measure. This policy environment will enhance investor confidence in the stock market, with expectations of more capital flowing into the market, driving up stock prices.
2.The PCE data released today fully met market expectations, providing solid data support for the upcoming rate cuts. The stable performance of this data indicates that the current inflation level is under effective control, thus giving the Federal Reserve room to implement rate cut policies to further stimulate economic growth. This scenario is a positive signal for the market.
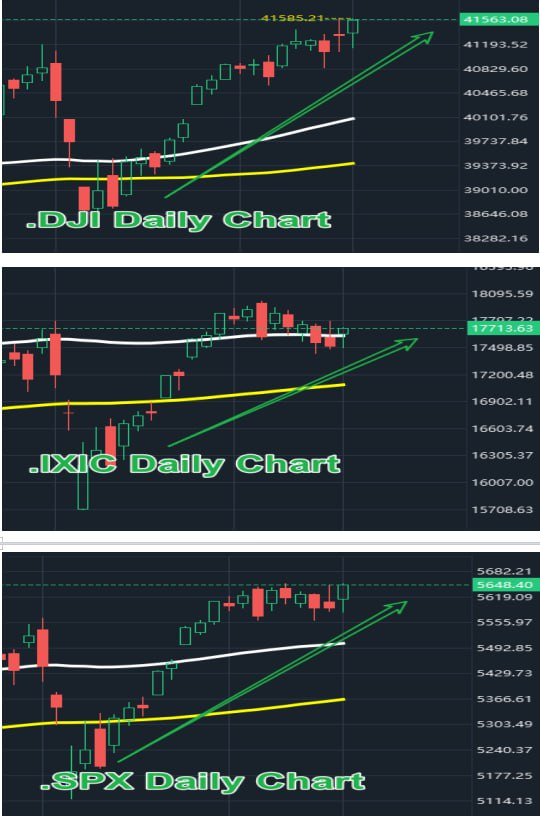
3.The trend direction of the three major stock indices has not changed.
The Dow Jones Industrial Average has reached an all-time high, with a very strong bullish trend, demonstrating the health of market fundamentals and the stability of investor confidence; meanwhile, the Nasdaq and S&P 500 indices are mainly showing a fluctuating pattern. Despite this, their overall trends remain upward. This indicates that although there are market fluctuations, investors generally have an optimistic outlook on the future, and the market structure is robust.
In summary, the current stock market investment environment is healthy and provides us with good opportunities for profit.
I believe the main trends in the current stock market trajectory are: the technology sector, gold sector, new energy vehicles, and cryptocurrency concepts.
In our investment portfolio:
Long-term strategy: Leading AI sector stock NVDA
Mid-term strategy: Gold sector NEM
Short-term strategy: New energy vehicles TSLA; Cryptocurrency concept stock MSTR; Technology sector AAPL
Next week, I will optimize our investment portfolio based on stock market trends, so please everyone pay close attention to the content shared in our community.
The content above summarizes this week, but at the same time, we should not forget to learn and accumulate practical skills. Continuous learning and practice are essential steps on our path to becoming investment experts. Now, let’s begin today’s learning journey—discussing how to determine the best buying and selling points in the stock trend pattern known as the “converging triangle.” By deeply understanding this key pattern, we can more precisely time the market, laying a solid foundation for investment success.
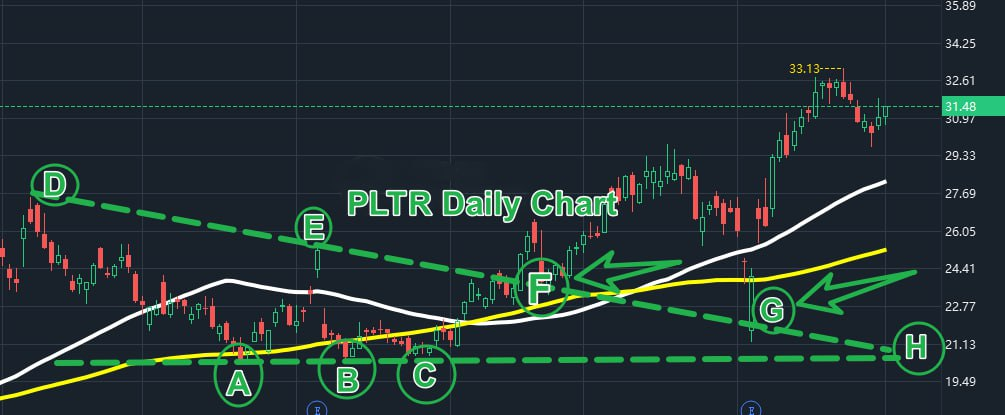
In technical analysis, the converging triangle pattern is a very critical price pattern, often appearing at key turning points in market trends. By observing the chart, we can clearly outline this pattern using lines, where the price trajectory shows a distinct gradual narrowing.
The converging triangle pattern typically symbolizes a gradual alignment of the balance of power between buyers and sellers in the market, reflecting an increase in uncertainty among market participants about future price directions. During this phase, the range of price fluctuations gradually narrows until a breakout point, which is often accompanied by changes in trading volume, ultimately leading to a significant price breakout either upwards or downwards.
From chart analysis, we can draw the following conclusions:
1.Within the converging triangle pattern, we observe that the price highs are gradually decreasing, forming a clear downward trend line for the upper boundary. This phenomenon reflects the diminishing pressure from sellers, with buyers beginning to gain the upper hand.
2.The converging triangle often appears when the market is in a state of indecision. During this phase, the forces of buyers and sellers are relatively balanced in the short term, leading to a gradual narrowing of the price fluctuation range. This price behavior indicates that market participants are uncertain about the future direction and are waiting for more information to make decisions.
3.In analyzing the converging triangle pattern, the most critical trading signal is whether the price can break through the upper or lower edge of the triangle. Typically, the direction of this breakout will determine the subsequent market trend. An upward breakout usually signifies the continuation or start of an uptrend, while a downward breach indicates the continuation or start of a downtrend.
Observing the chart, we can clearly see the converging triangle formed by points A, B, C, D, E, F, G, and H. Here, points A, B, and C are very strong support positions, while points D, E, F, and G are significant resistance positions. In this pattern, investors can adopt a strategy of selling high and buying low, paying special attention to the positions of the upper and lower edges of the converging triangle.
Especially points F and G in the chart, these two points are critical locations on the upper edge of the converging triangle. Now that the price has successfully broken through this upper edge, the market has chosen an upward direction, forming a one-sided upward trend.
Dear friends, I hope you all have been able to grasp the content I’ve shared and have taken careful notes. I believe that through my sharing in the community, everyone’s investment knowledge will be significantly enhanced. I am confident that in the near future, each of you has the potential to become an expert in the investment field.
The weekend has arrived, and I encourage everyone to fully enjoy every beautiful moment spent with family and friends, creating wonderful memories with your loved ones. Have a great weekend, everyone.
The weekend has arrived, and I encourage everyone to fully enjoy every wonderful moment spent with family and friends. Create beautiful memories with your loved ones. Have a great weekend, everyone.
